
Close Menu

    Subscribe to Updates

    Get the latest creative news from FooBar about art, design and business.

    What's Hot

    When mothers-in-law make room, more women build – Businessday NG

    October 28, 2026

    James Talarico faces off against Trump in dueling Texas rallies in election’s final days

    October 28, 2026

    UN biodiversity summit enters crucial final week amid funding disputes and calls for urgent action

    October 28, 2026
    Facebook X (Twitter) Instagram
    Trending
    • When mothers-in-law make room, more women build – Businessday NG
    • James Talarico faces off against Trump in dueling Texas rallies in election’s final days
    • UN biodiversity summit enters crucial final week amid funding disputes and calls for urgent action
    • JIFAN – Napwisha | Mp3 Download
    • Chiefs’ Da Cruz believes hat-trick hero Duba has bright future
    • Netanyahu scrambles for votes as Israelis turn out in record numbers – World
    • Has Michael Carrick lost his magic wand? – Businessday NG
    • Modi Privacy Law Threatens Press Freedom, Publishers Argue
    X (Twitter) Instagram YouTube
    iFonge
    • Africa News
    • World News
    • Economy
    • Entertainment
    • Finance
    • Politics
    • sports
    iFonge
    Home » Africa Commodity Terms of Trade: January–May 2026
    Africa News

    Africa Commodity Terms of Trade: January–May 2026

    ifongeBy ifongeOctober 27, 2026No Comments1 Views
    Facebook Twitter Pinterest LinkedIn WhatsApp Reddit Tumblr Email
    Share
    Facebook Twitter LinkedIn Pinterest Email

    IMF data for 51 African economies show that the commodity net export price index rose in 14 of them and fell in 37 between January–February and March–May 2026. The commodity import price index rose in all 51.

    Africa Commodity Terms of Trade: January–May 2026
    Photo courtesy of Rifat Rahman.

    By Rifat Rahman

    What was measured

    The International Monetary Fund’s Commodity Terms of Trade database (version 5.0.1, published 15 June 2026) tracks, for each country, the international prices of up to 45 commodities weighted by that country’s own trade in them. In the IMF’s words, the net index “proxies the windfall gains and losses of income associated with changes in world prices”.

    This article uses three of the database’s series, each weighted to GDP and each using weights based on average trade over the preceding three years: a net export price index, an import price index and an export price index. For every economy, the average for January and February 2026 is compared with the average for March, April and May 2026, the latest month available in the source export used for this analysis. Changes are reported in index points and, separately, as a percentage of the January–February level.

    The sample covers all 51 African economies with complete data for the period. Equatorial Guinea has no 2026 values in the database; Somalia and South Sudan are not included in it.

    Fourteen rises, thirty-seven falls

    The net index rose in 14 economies and fell in 37. The median change was −2.06 points.

    The seven largest increases were in Gabon, +16.89 points (+22.77%); Angola, +14.33 points (+17.65%); the Republic of Congo, +13.49 points (+16.09%); Libya, +8.30 points (+10.13%); Algeria, +7.80 points (+8.59%); Chad, +6.96 points (+7.49%); and Nigeria, +4.50 points (+4.81%). These seven are the economies in the sample that the IMF’s World Economic Outlook of April 2026 classifies as fuel exporters — those whose fuel exports exceeded half of total exports on average in 2020–24.
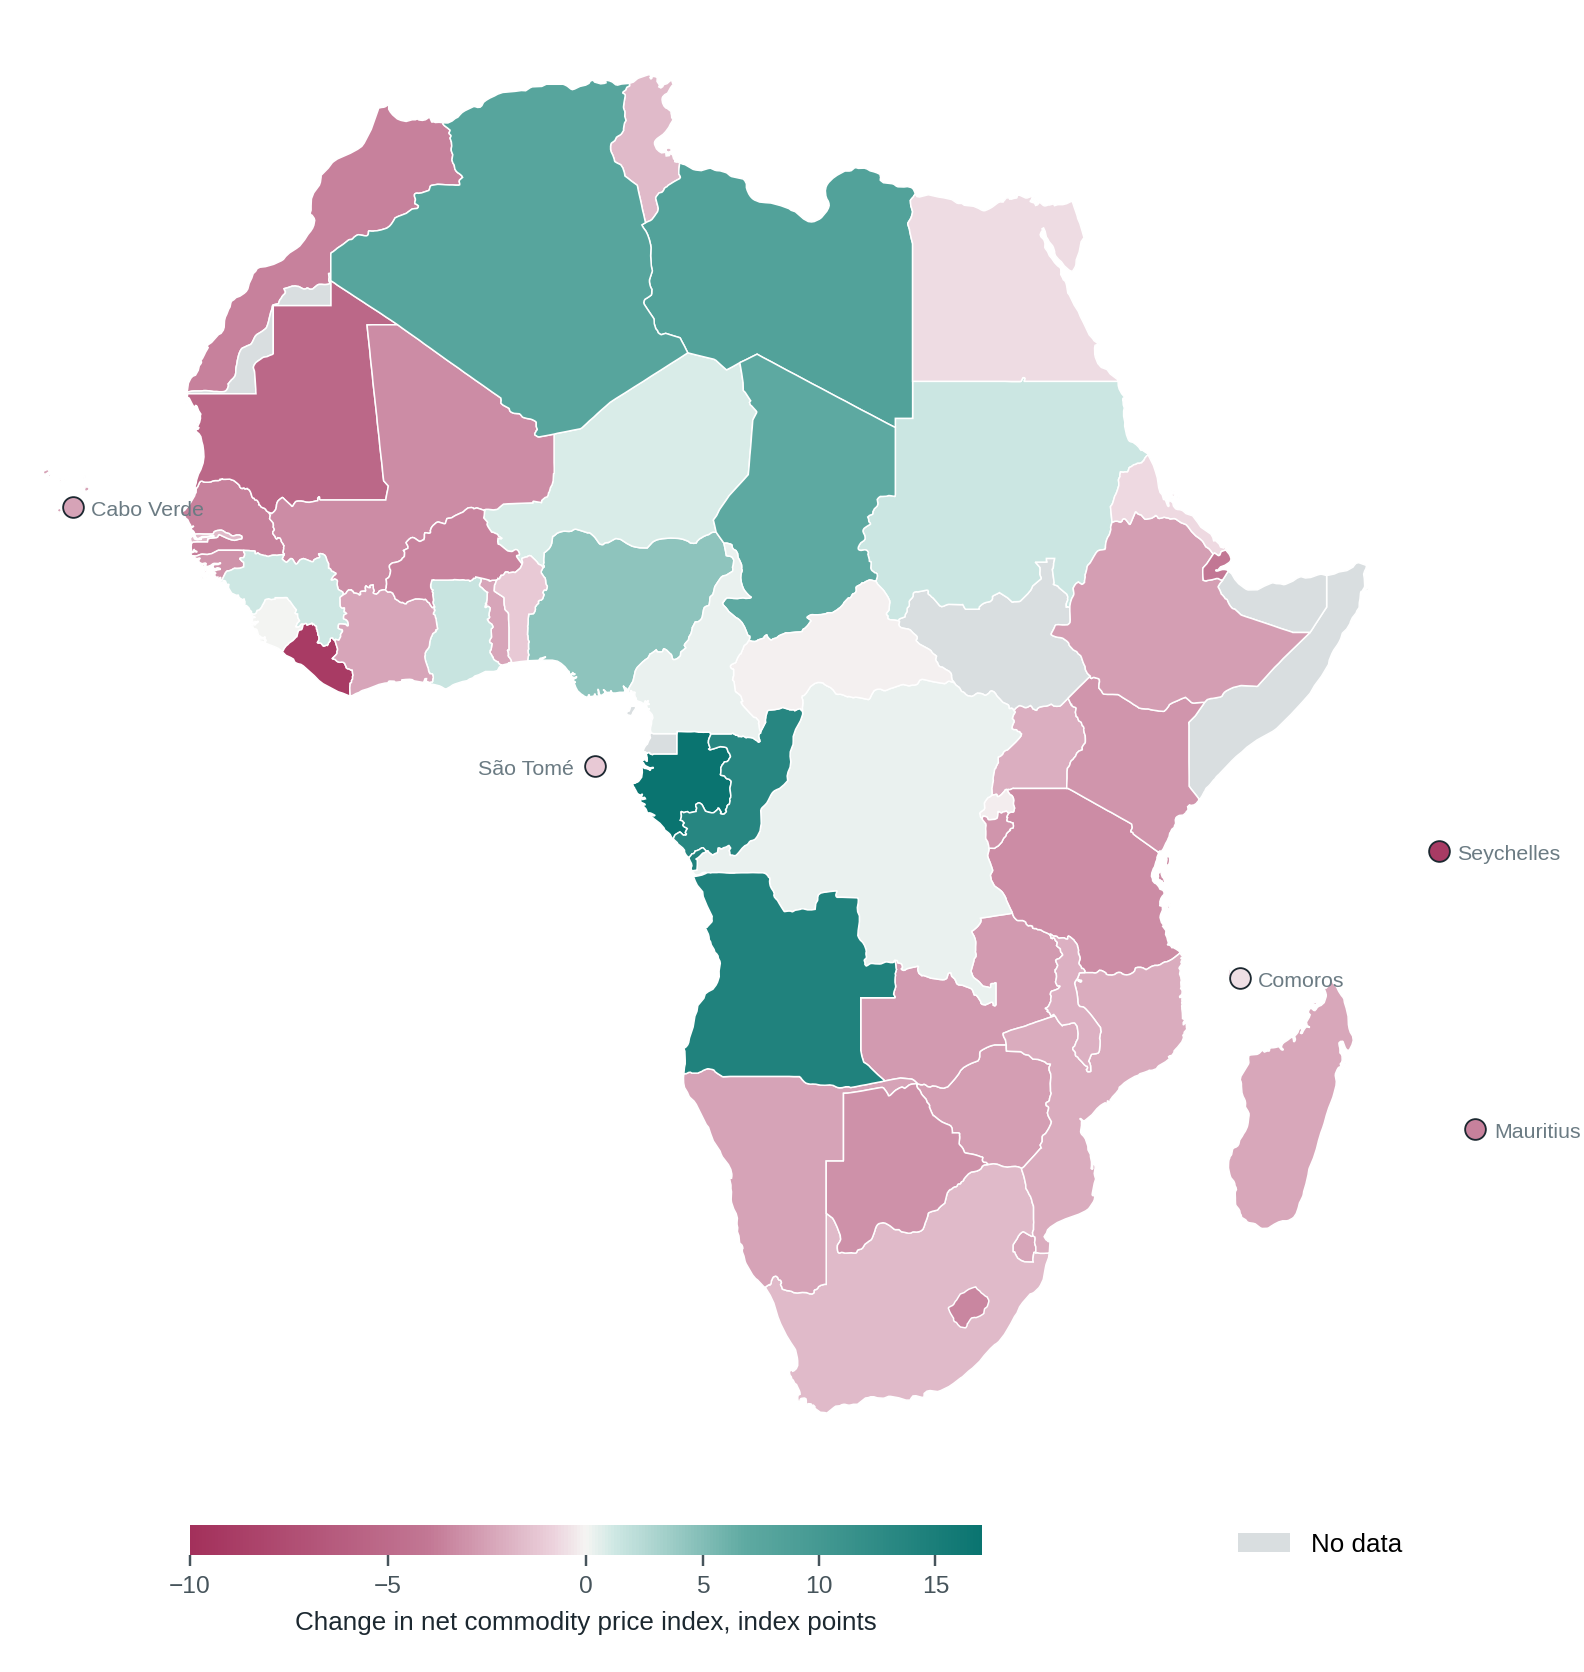
    Map of changes in the commodity net export price index across 51 African economies, March–May versus January–February 2026
    Chart 1. Change in the IMF commodity net export price index (weighted to GDP), index points: average of March–May 2026 minus average of January–February 2026. Grey: no data. Source: IMF Commodity Terms of Trade database, v5.0.1; author’s calculations. Chart by Rifat Rahman.

    Seven other economies recorded smaller increases: Ghana, +1.55 points (+1.41%); Sudan, +1.34 points (+1.30%); Guinea, +1.32 points (+1.21%); Niger, +0.83 points (+0.81%); the Democratic Republic of the Congo, +0.32 points (+0.30%); Cameroon, +0.27 points (+0.27%); and Sierra Leone, +0.02 points (+0.02%). In 5 economies the change was less than half a point in either direction.

    The largest decreases were in Seychelles, −9.05 points (−7.43%); Liberia, −9.03 points (−8.01%); Mauritania, −5.27 points (−4.86%); Djibouti, −4.04 points (−3.84%); Mauritius, −3.66 points (−3.52%); and Morocco, −3.64 points (−3.44%). The index also fell in Kenya, −2.91 points (−2.83%); Ethiopia, −2.63 points (−2.54%); South Africa, −1.66 points (−1.62%); and Egypt, −0.62 points (−0.61%).
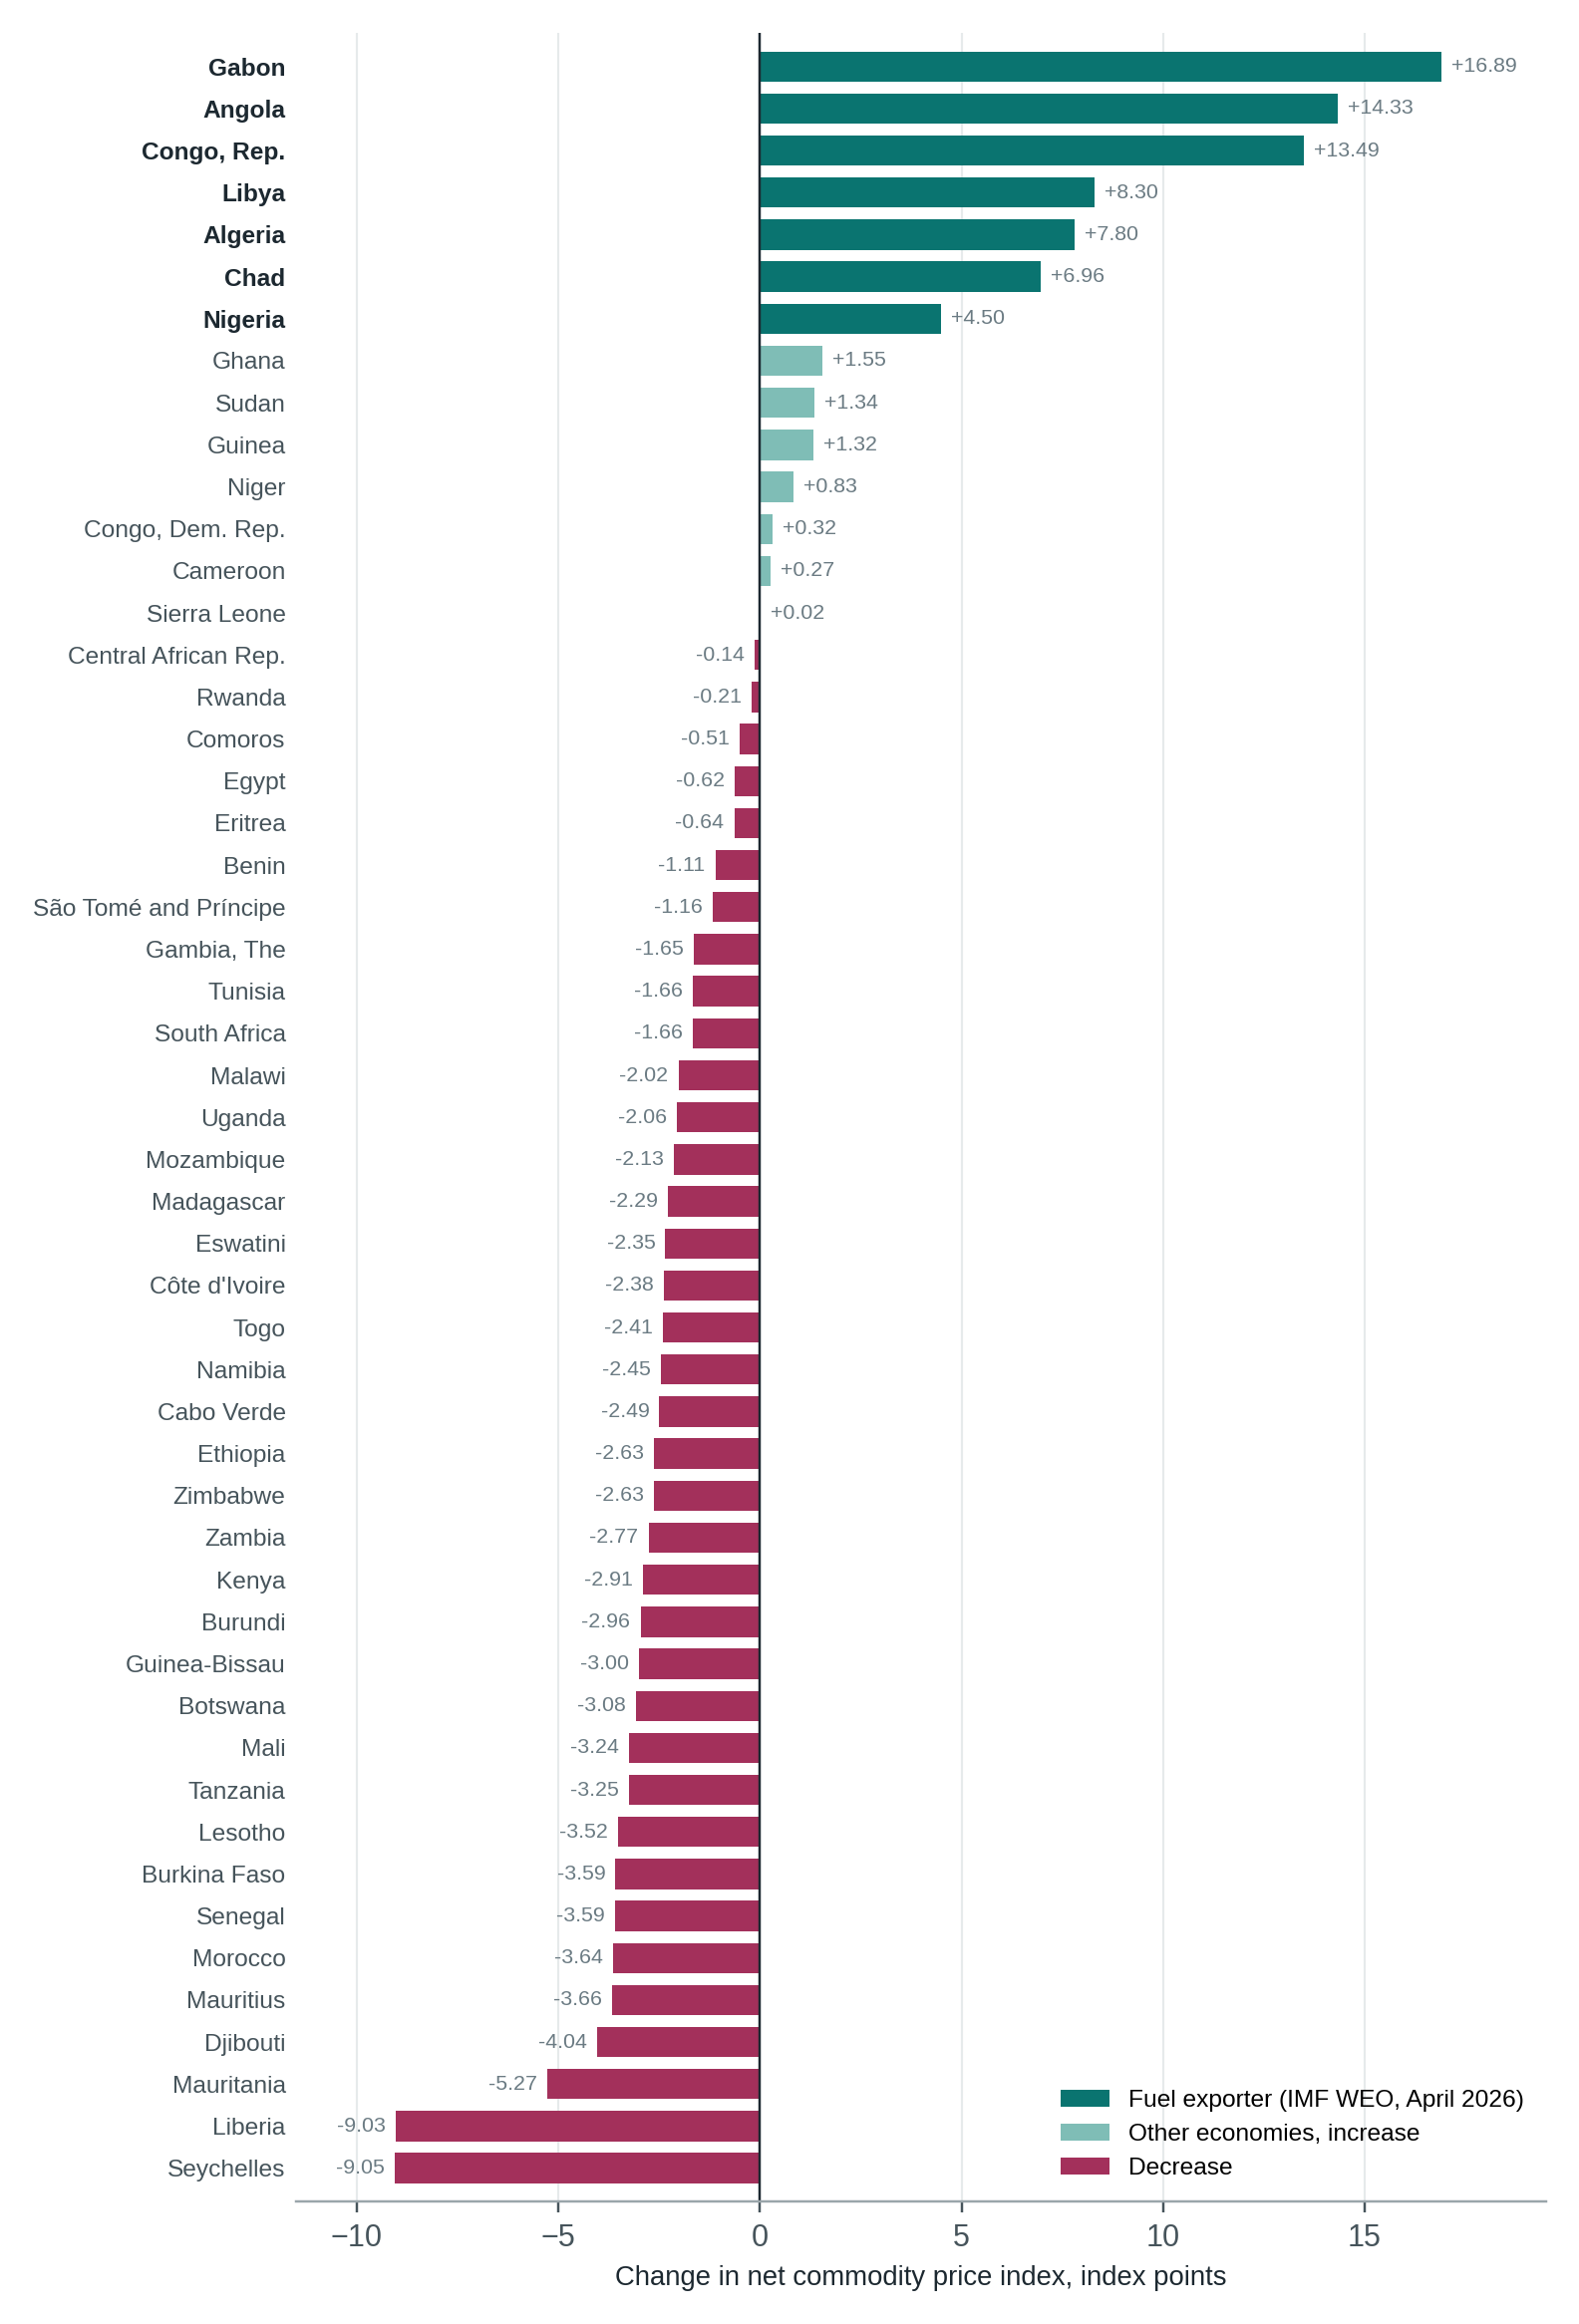
    Ranking of 51 African economies by commodity net export price index change, led by Gabon, Angola and the Republic of Congo
    Chart 2. The same measure for all 51 economies, ranked. Fuel exporters as classified in IMF World Economic Outlook, April 2026, Statistical Appendix, Table D. Source: IMF Commodity Terms of Trade database, v5.0.1; author’s calculations. Chart by Rifat Rahman.

    Import and export prices

    The import price index rose in every one of the 51 economies, by between +0.11 points in Chad and +7.97 points in Liberia, with a median rise of +2.36 points. The export price index rose in 36 economies and fell in 15.

    The two series moved differently in the two groups. In the seven fuel exporters, the export index rose by between +5.02 and +17.21 points, while the import index rose by no more than +1.24 points. In 22 of the 37 economies where the net index fell, the export index nonetheless rose.
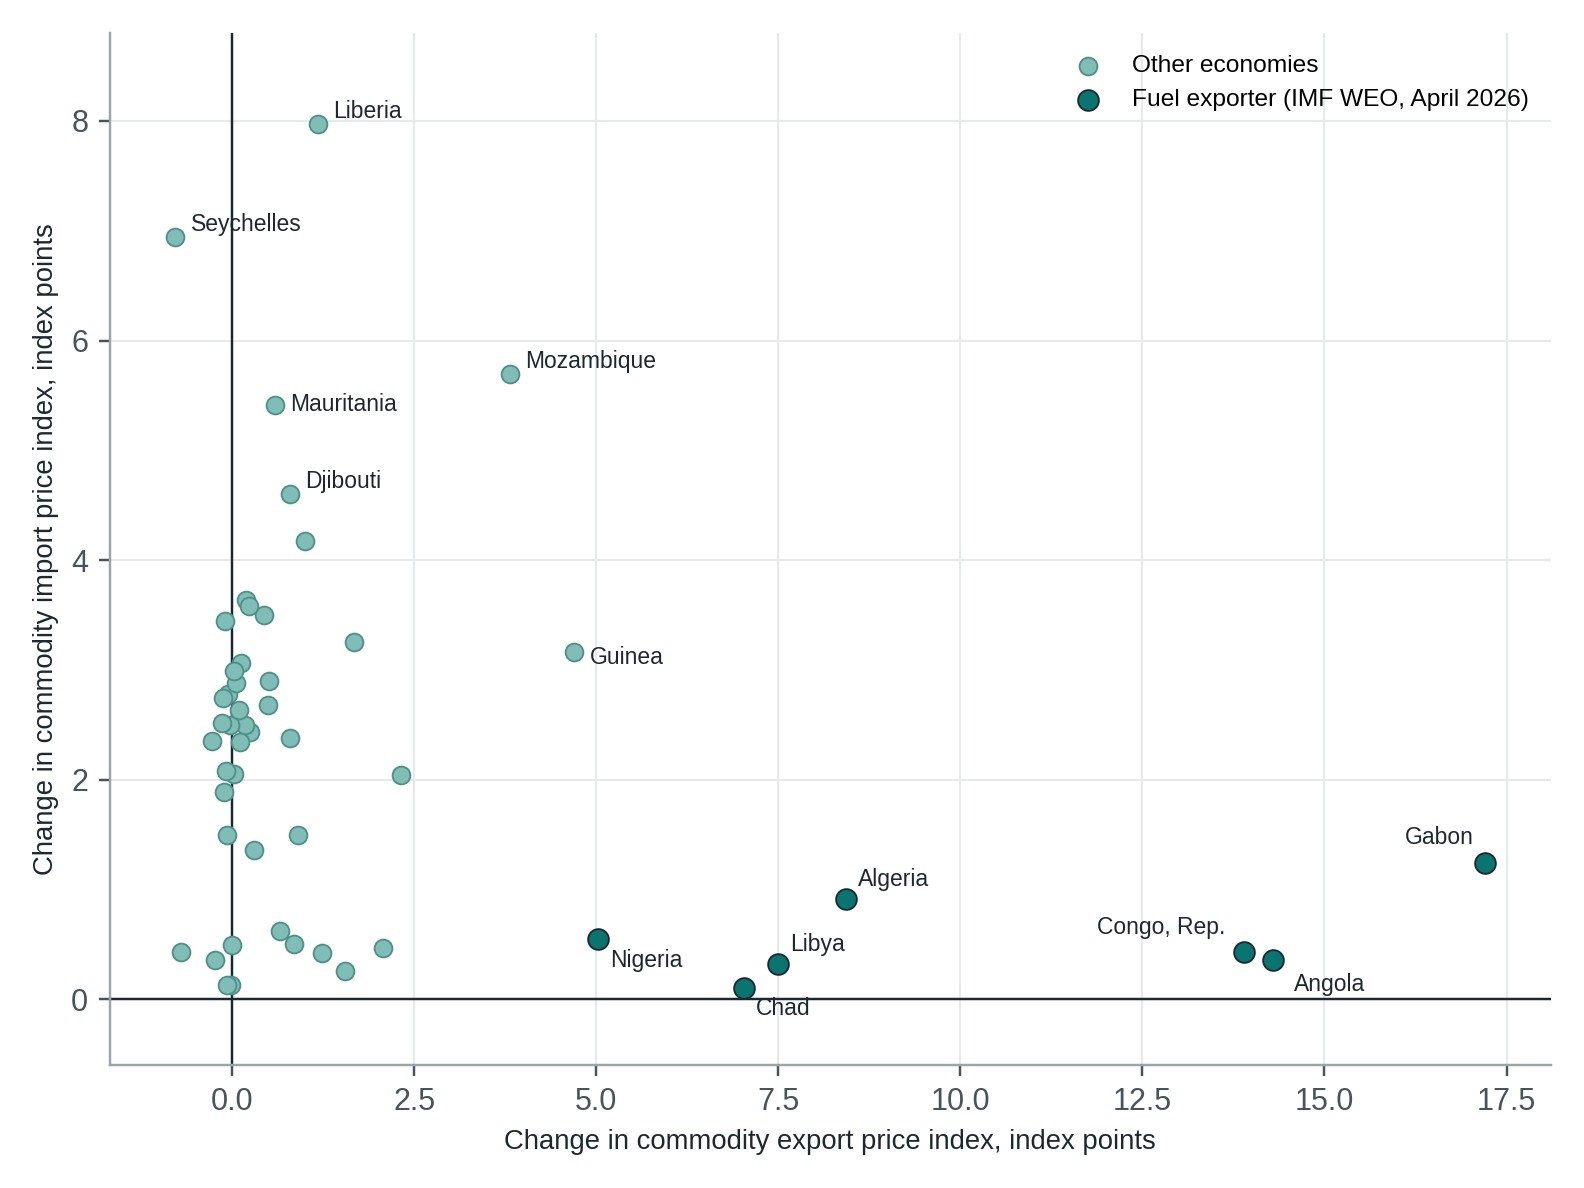
    Changes in commodity export and import price indices across 51 African economies, with seven fuel exporters highlighted
    Chart 3. Change in the commodity import and export price indices (each weighted to GDP), index points, March–May 2026 against January–February 2026, 51 economies. Source: IMF Commodity Terms of Trade database, v5.0.1; author’s calculations. Chart by Rifat Rahman.

    Oil prices over the same months

    The Brent crude oil spot price averaged $68.74 a barrel in January and February 2026 and $109.19 in March to May, a rise of 58.8%, according to daily data from the Federal Reserve Bank of St. Louis. The monthly average peaked at $117.29 in April.

    In its April 2026 Short-Term Energy Outlook, the US Energy Information Administration reported that military action in the Middle East had begun on 28 February 2026 and that the Strait of Hormuz had been effectively closed to shipping traffic since then. In a separate note on 7 April 2026, it described the first-quarter rise in the front-month Brent crude oil futures price as the largest on an inflation-adjusted basis in data going back to 1988.
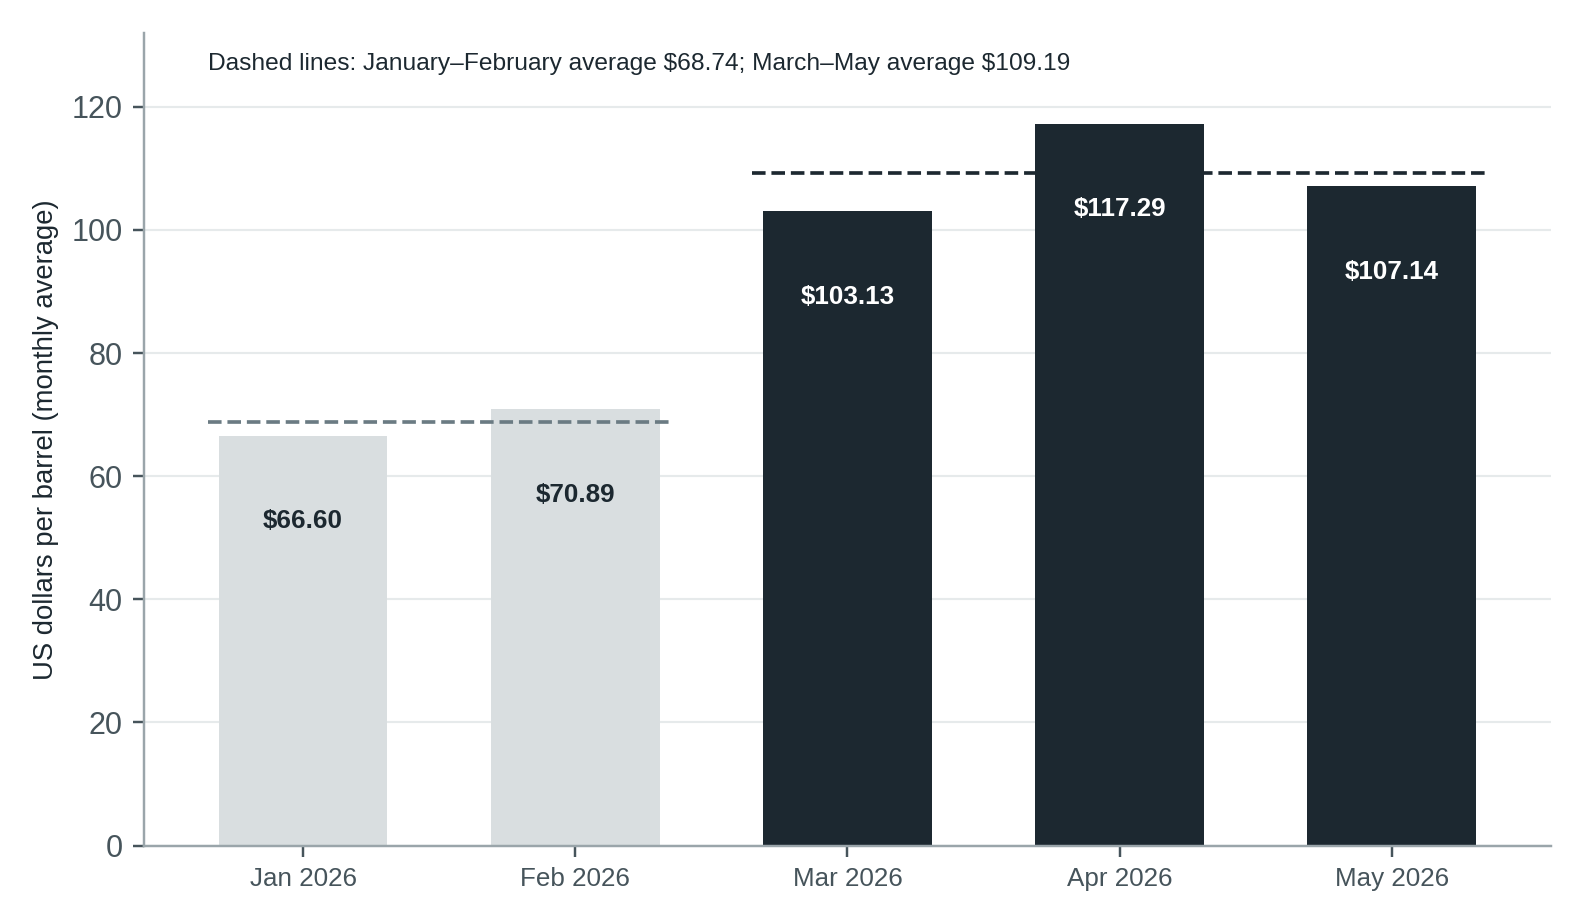
    Brent crude oil monthly average prices from January to May 2026, peaking at 117.29 US dollars per barrel in April
    Chart 4. Brent crude oil spot price, monthly average of daily values, US dollars per barrel. Source: Federal Reserve Bank of St. Louis, FRED series DCOILBRENTEU (data updated 16 September 2026). Chart by Rifat Rahman.

    This article does not estimate how much of the change in any country’s index is attributable to these events. The indices combine the prices of up to 45 commodities, and the data used here do not separate the contribution of any single commodity or cause.

    What the data do not show

    The indices measure prices, not quantities. They do not show changes in trade volumes, national income, government revenue or household welfare, and no such estimates are made here. The weights reflect trade patterns in the preceding three years, which may differ from trade during the period. The comparison covers three months against two; the IMF may revise the underlying data.

    Data note

    Figures are calculated from the IMF Commodity Terms of Trade database, v5.0.1 (published 15 June 2026; downloaded 23 August 2026), series “Commodity Net Export / Import / Export Price Index, Individual Commodities Weighted by Ratio of Net Exports / Imports / Exports to GDP”, weight type “Recent, Rolling weights, Index”. Country groups: IMF World Economic Outlook, April 2026, Statistical Appendix, Table D. Oil prices: FRED series DCOILBRENTEU. The author’s Excel workbook is a working copy containing source values, series codes and calculation formulas. The original IMF CSV export was supplied separately for editorial verification.

    About the author

    Rifat Rahman is a data analyst specialising in public economic and government datasets. A Microsoft Certified Data Management Specialist, he spent four years working with the UN International Organization for Migration before joining Transparency International Bangladesh, where his work spans public procurement, national elections, and macroeconomic analysis. His analysis draws on open-source IMF, World Bank, and Eurostat primary data.

    Sources

    IMF Commodity Terms of Trade database, version 5.0.1, published 15 June 2026; source export downloaded 23 August 2026. Calculations by Rifat Rahman.

    IMF World Economic Outlook, April 2026, Statistical Appendix, Table D, for the classification of fuel exporters.

    FRED series DCOILBRENTEU: Crude Oil Prices, Brent — Europe, for the author’s January–May 2026 oil-price calculations.

    EIA Short-Term Energy Outlook, April 2026, for the dated account of oil-market disruption.

    EIA Today in Energy, 7 April 2026, for the first-quarter Brent futures price comparison.

    Africa Commodity JanuaryMay terms trade
    Share. Facebook Twitter Pinterest LinkedIn Tumblr Telegram Email
    ifonge
    • Website
    • X (Twitter)
    • Instagram

    Related Posts

    UN biodiversity summit enters crucial final week amid funding disputes and calls for urgent action

    October 28, 2026

    Modi Privacy Law Threatens Press Freedom, Publishers Argue

    October 27, 2026

    OPINION | Why Sifuna is the top graduate of ‘Raila Odinga Academy of Politics’

    October 26, 2026
    Leave A Reply Cancel Reply

    Top Posts

    Trauma Bonding in Relationships and How Trauma Attachment, Abuse, and Emotional Dependence Form Hard to Break Bonds

    April 28, 2026139

    Iran live updates: Trump vows ‘bigger, and better’ Iran attacks if deal not reached

    April 9, 202655

    Strait of Hormuz ‘completely open’, Iran says; Stock market continues its record-setting rally

    April 17, 202631

    Tyson Fury will pay unique tribute to Ricky Hatton in Makhmudov comeback fight

    April 10, 202618
    Follow Us
    • Twitter
    • Instagram
    • YouTube

    Subscribe to Updates

    Get the latest news from iFonge.

    About Us
    About Us

    At Ifonge, we are dedicated to delivering high-quality content across multiple categories including National News, International News, Economy, Entertainment, Finance, Health, Lifestyle, Politics, and Sports.

    Our Picks

    When mothers-in-law make room, more women build – Businessday NG

    October 28, 2026

    James Talarico faces off against Trump in dueling Texas rallies in election’s final days

    October 28, 2026

    UN biodiversity summit enters crucial final week amid funding disputes and calls for urgent action

    October 28, 2026
    Most Popular

    Trauma Bonding in Relationships and How Trauma Attachment, Abuse, and Emotional Dependence Form Hard to Break Bonds

    April 28, 2026139

    Iran live updates: Trump vows ‘bigger, and better’ Iran attacks if deal not reached

    April 9, 202655

    Strait of Hormuz ‘completely open’, Iran says; Stock market continues its record-setting rally

    April 17, 202631
    © 2026 All rights reserved iFonge.
    • Home
    • About us
    • DISCLAIMER
    • Privacy Policy
    • Contact

    Type above and press Enter to search. Press Esc to cancel.